Isometric process infographic
Explain a four-step process with a clean isometric infographic.

Original recipe · oimg.ai team · Jun 19, 2026
Original example prompt authored by the oimg.ai team — free to copy and adapt.
- Model
- Ideogram 3
- Aspect ratio
- 3:4
- 카테고리
- 인포그래픽 & 차트
변수를 바꿔보세요
이미지가 아니라 구조를 가져오세요. 강조된 {{TOKEN}}을 각각 원하는 소재로 바꾼 뒤 생성하세요.
A vertical infographic explaining the {{TOPIC}} process in {{STEP_COUNT}} steps, laid out top-to-bottom along a dotted path. Render each step as a small isometric scene with a numbered label and a one-line caption, using a {{PALETTE}} palette and flat shadows. Keep ample spacing and aligned baselines. Produce it as a clean explainer graphic with legible, correctly spelled labels.
효과적인 이유
- A single dotted path makes step order obvious at a glance.
- Consistent isometric scenes and one palette unify a multi-step graphic.
- Numbered labels plus short captions keep cognitive load low.
- Requesting correct spelling reduces broken-label failures.
나만의 버전 만들기
- 1프롬프트 복사하기
- 2나만의 소재와 디테일로 바꾸기
- 3생성하기
주의할 점
- Too many steps crowd the column; cap it around four or five.
- Long captions misrender; keep them terse.
관련 레시피
View all prompts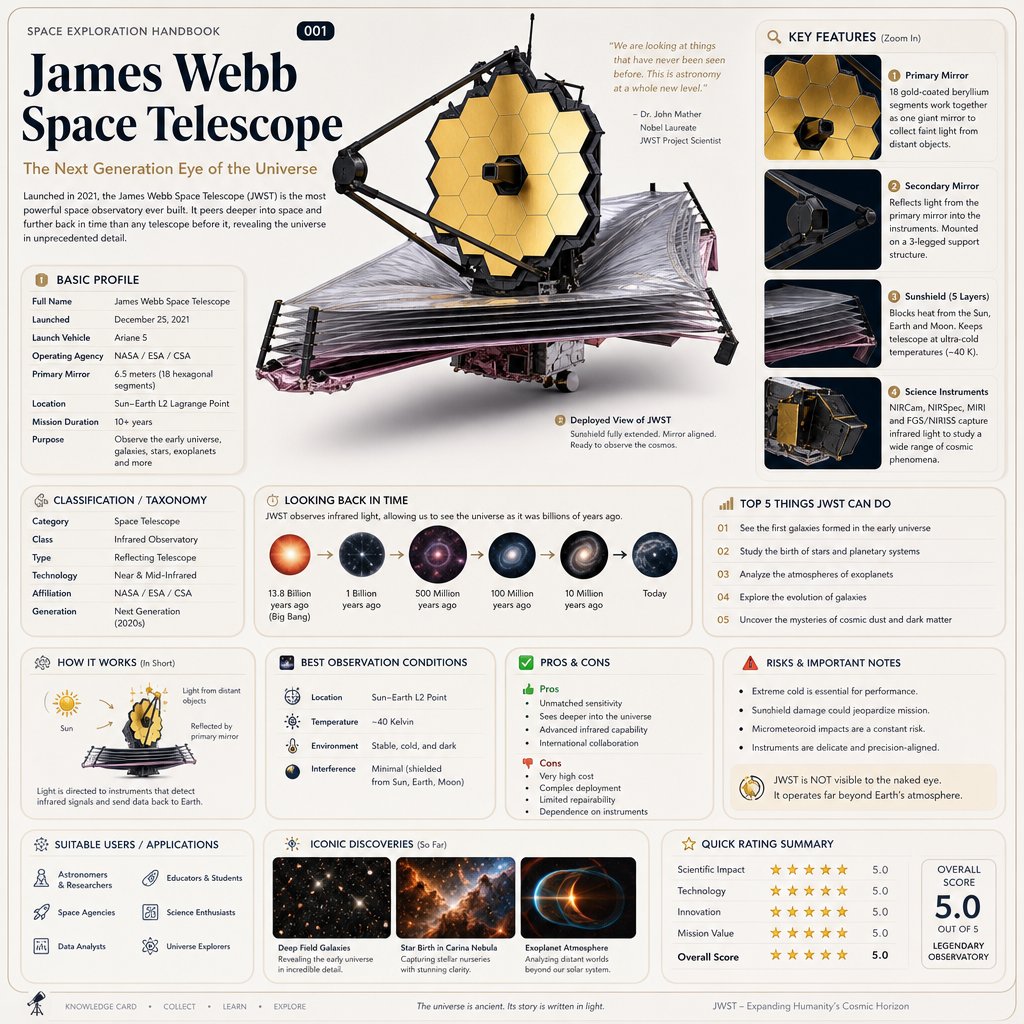 GPT Image 2
Based on { TOPIC }
Real prompt shared by @oggii_0 on X
 GPT Image 2
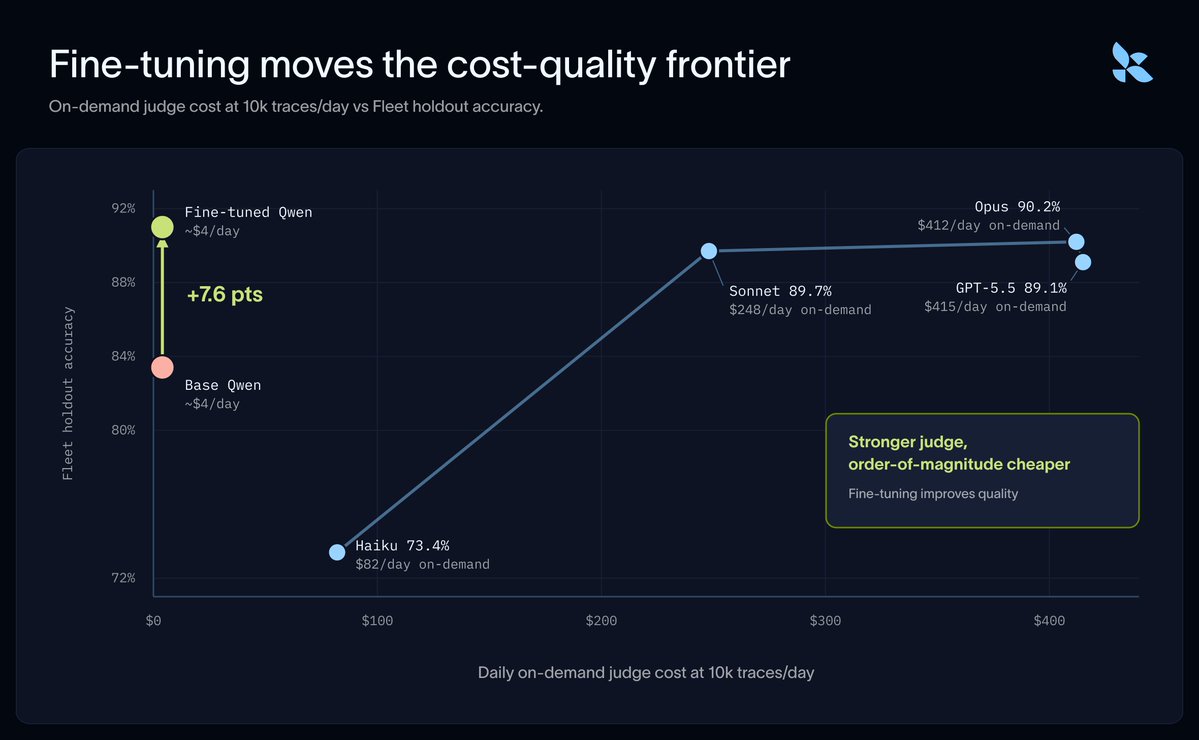
langchain and fireworks just shipped the eval move worth ste
Real prompt shared by @rohit4verse on X
 GPT Image 2
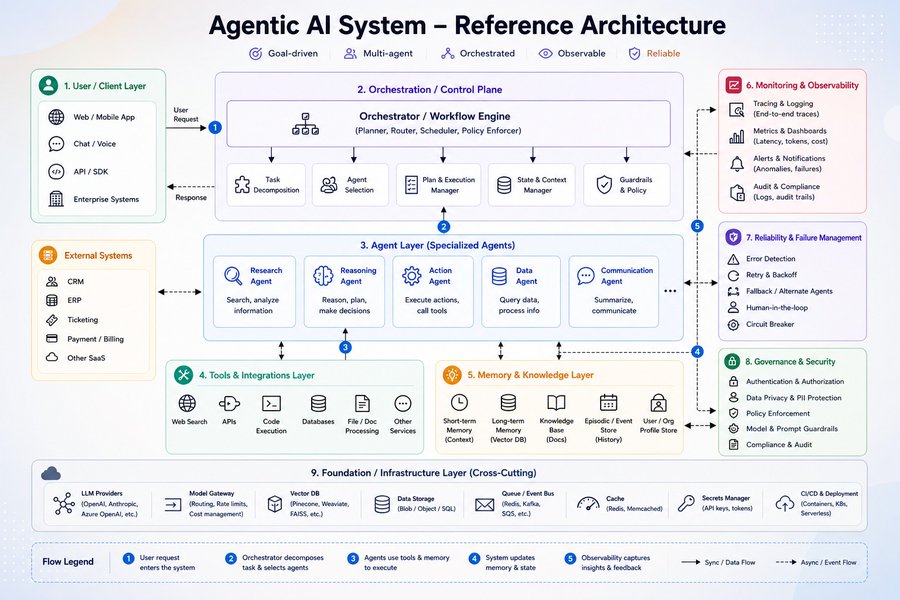
Most people talk about Agentic AI.
Real prompt shared by @MeenakshiYACS on X
 Flux.1
Side-by-side comparison chart
Compare two options in a balanced, scannable layout.
![Create a technical infographic of [OBJECT] with a 45-degree](https://pub-649b83e8ac7f4d49a8969c803209fbb6.r2.dev/cases/gudanglifehack-2034616405463896463.jpg) GPT Image 2
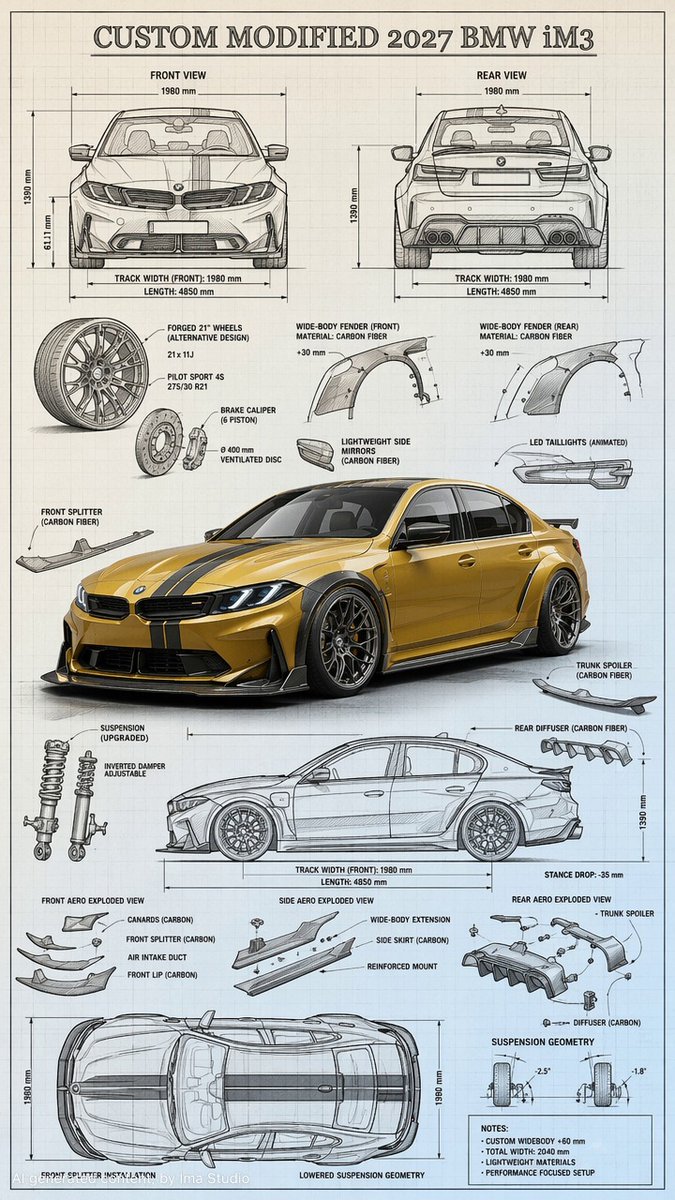
GPT Image 2Create a technical infographic of [OBJECT] with a 45-degree
Real prompt shared by @gudanglifehack on X
![Create a technical infographic of [OBJECT] with a 45-degree](https://pub-649b83e8ac7f4d49a8969c803209fbb6.r2.dev/cases/gudanglifehack-2034618711861297322.jpg) GPT Image 2
GPT Image 2Create a technical infographic of [OBJECT] with a 45-degree
Real prompt shared by @gudanglifehack on X
 GPT Image 2
“Highly detailed technical blueprint sketch and realistic 3D
Real prompt shared by @ShamiWeb3 on X
 GPT Image 2
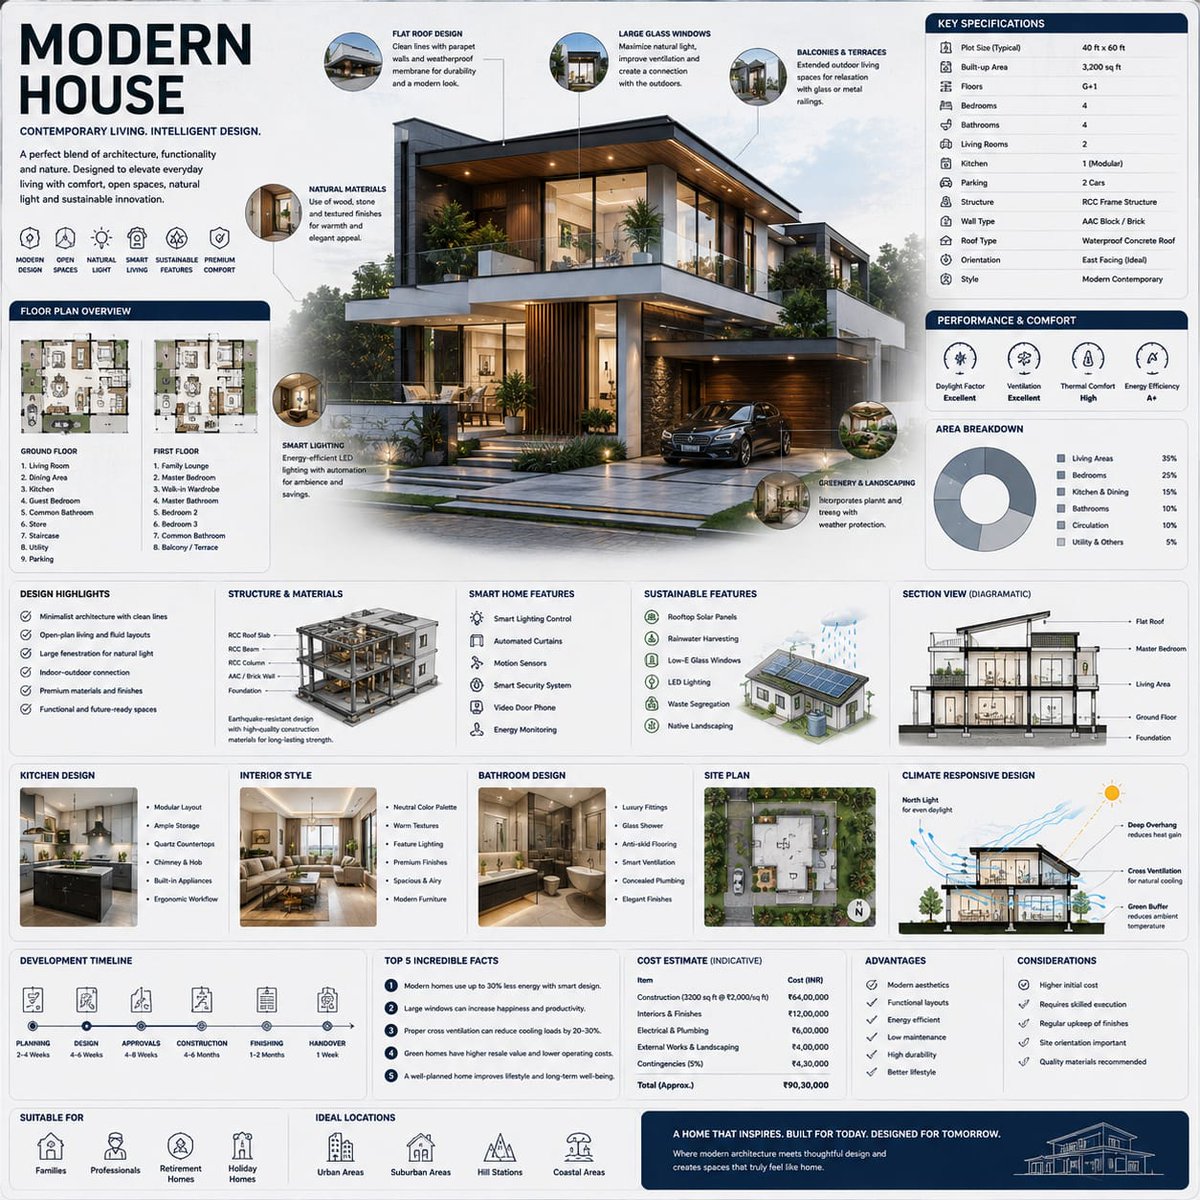
Modern House infographics created using GPT Image 2 on ChatG
Real prompt shared by @mehvishs25 on X